Screenshots
Login page
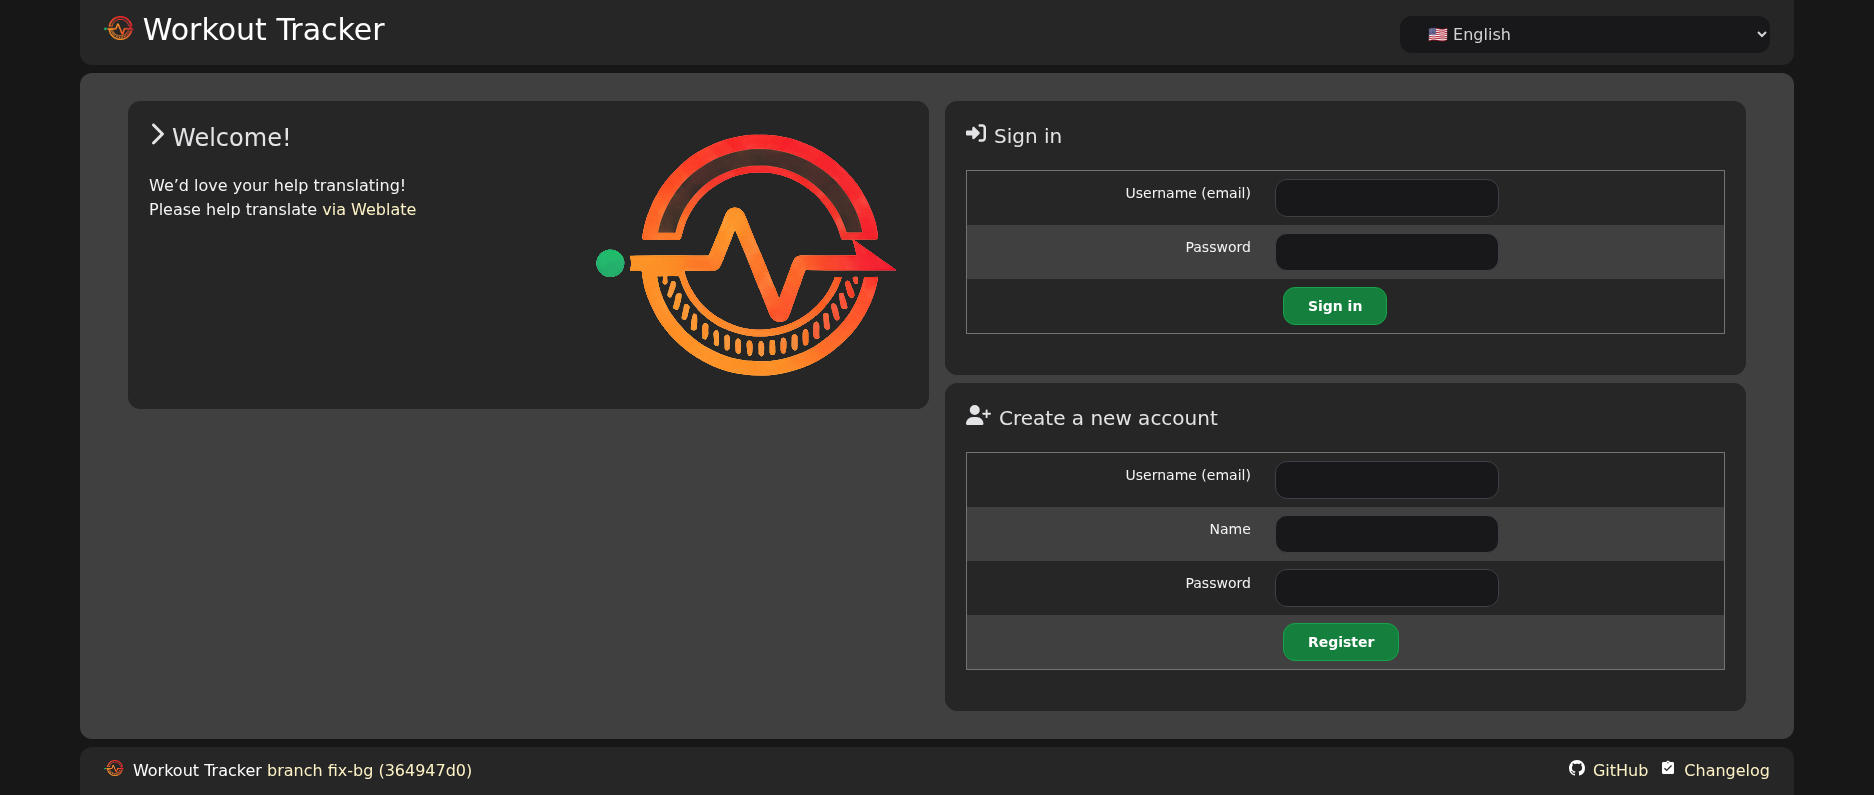
Login / registration form
- new users have to be activated by an admin
- registration can be disabled
Dashboard
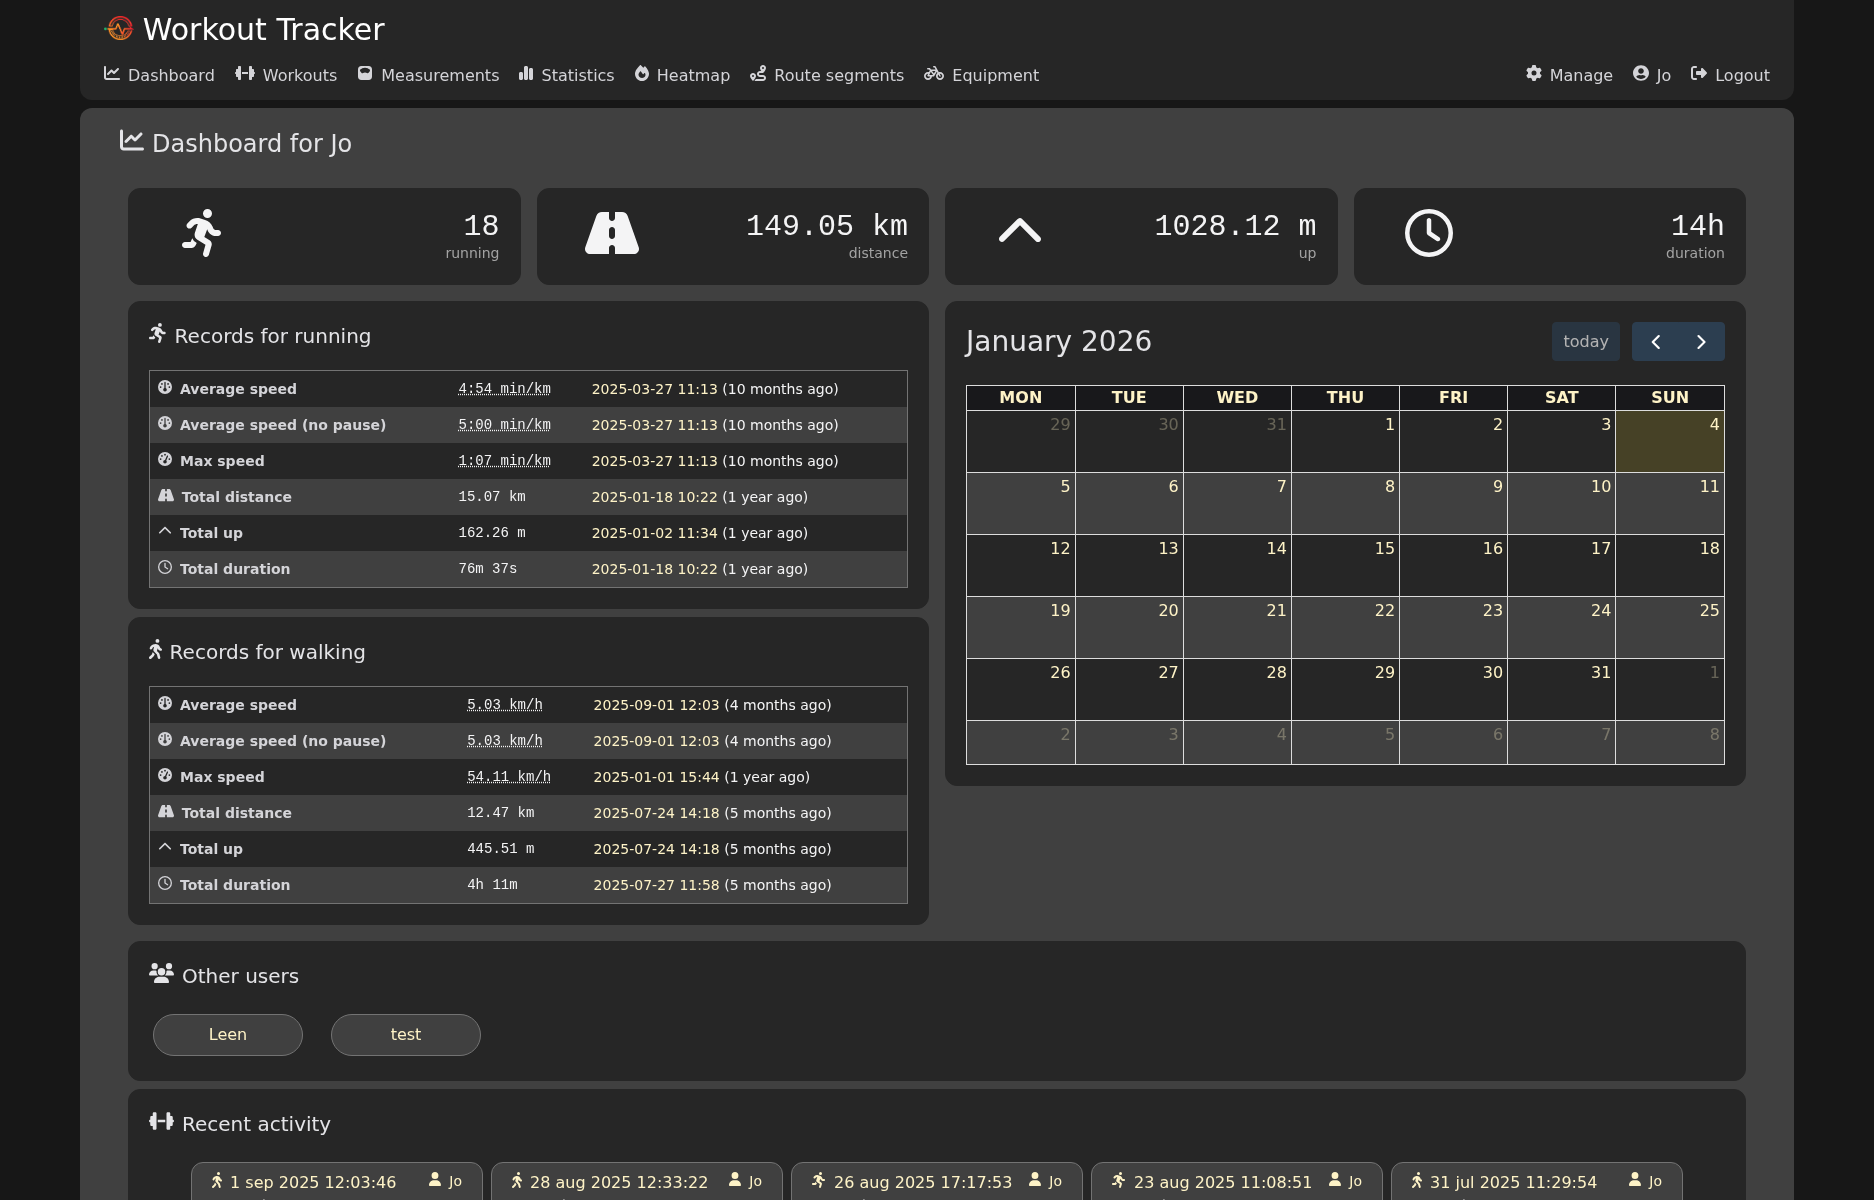
Dashboard view with:
- personal totals
- running records
- a calendar view
- recent activities (by you and other users)
Overview of workouts
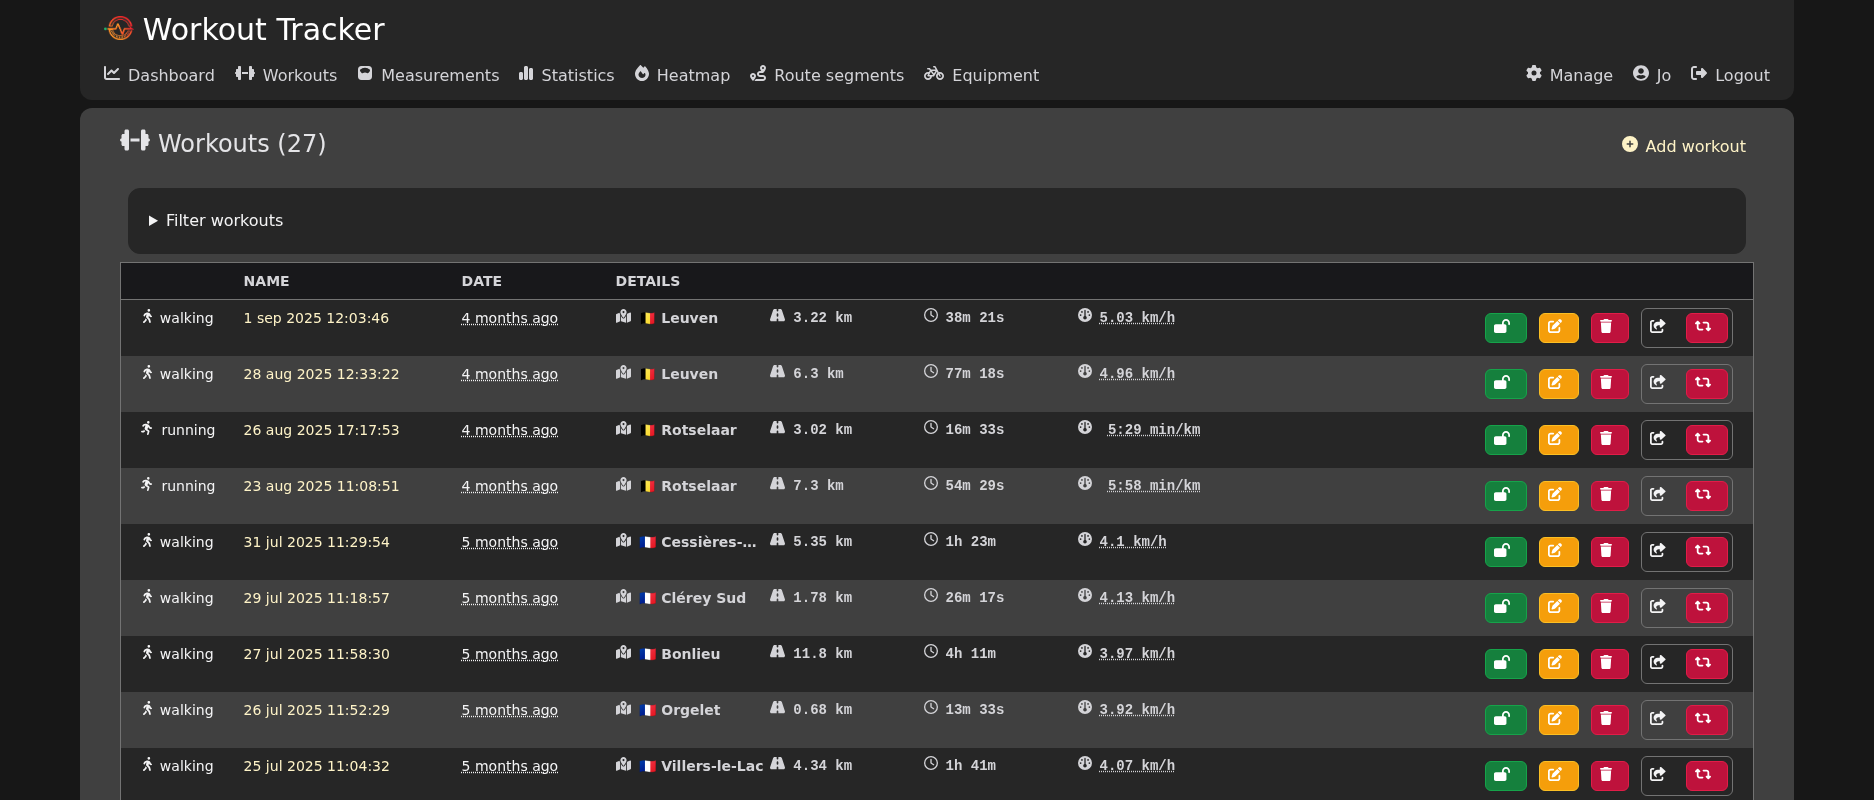
Overview of all your activities, with summaries.
Details of a single workout
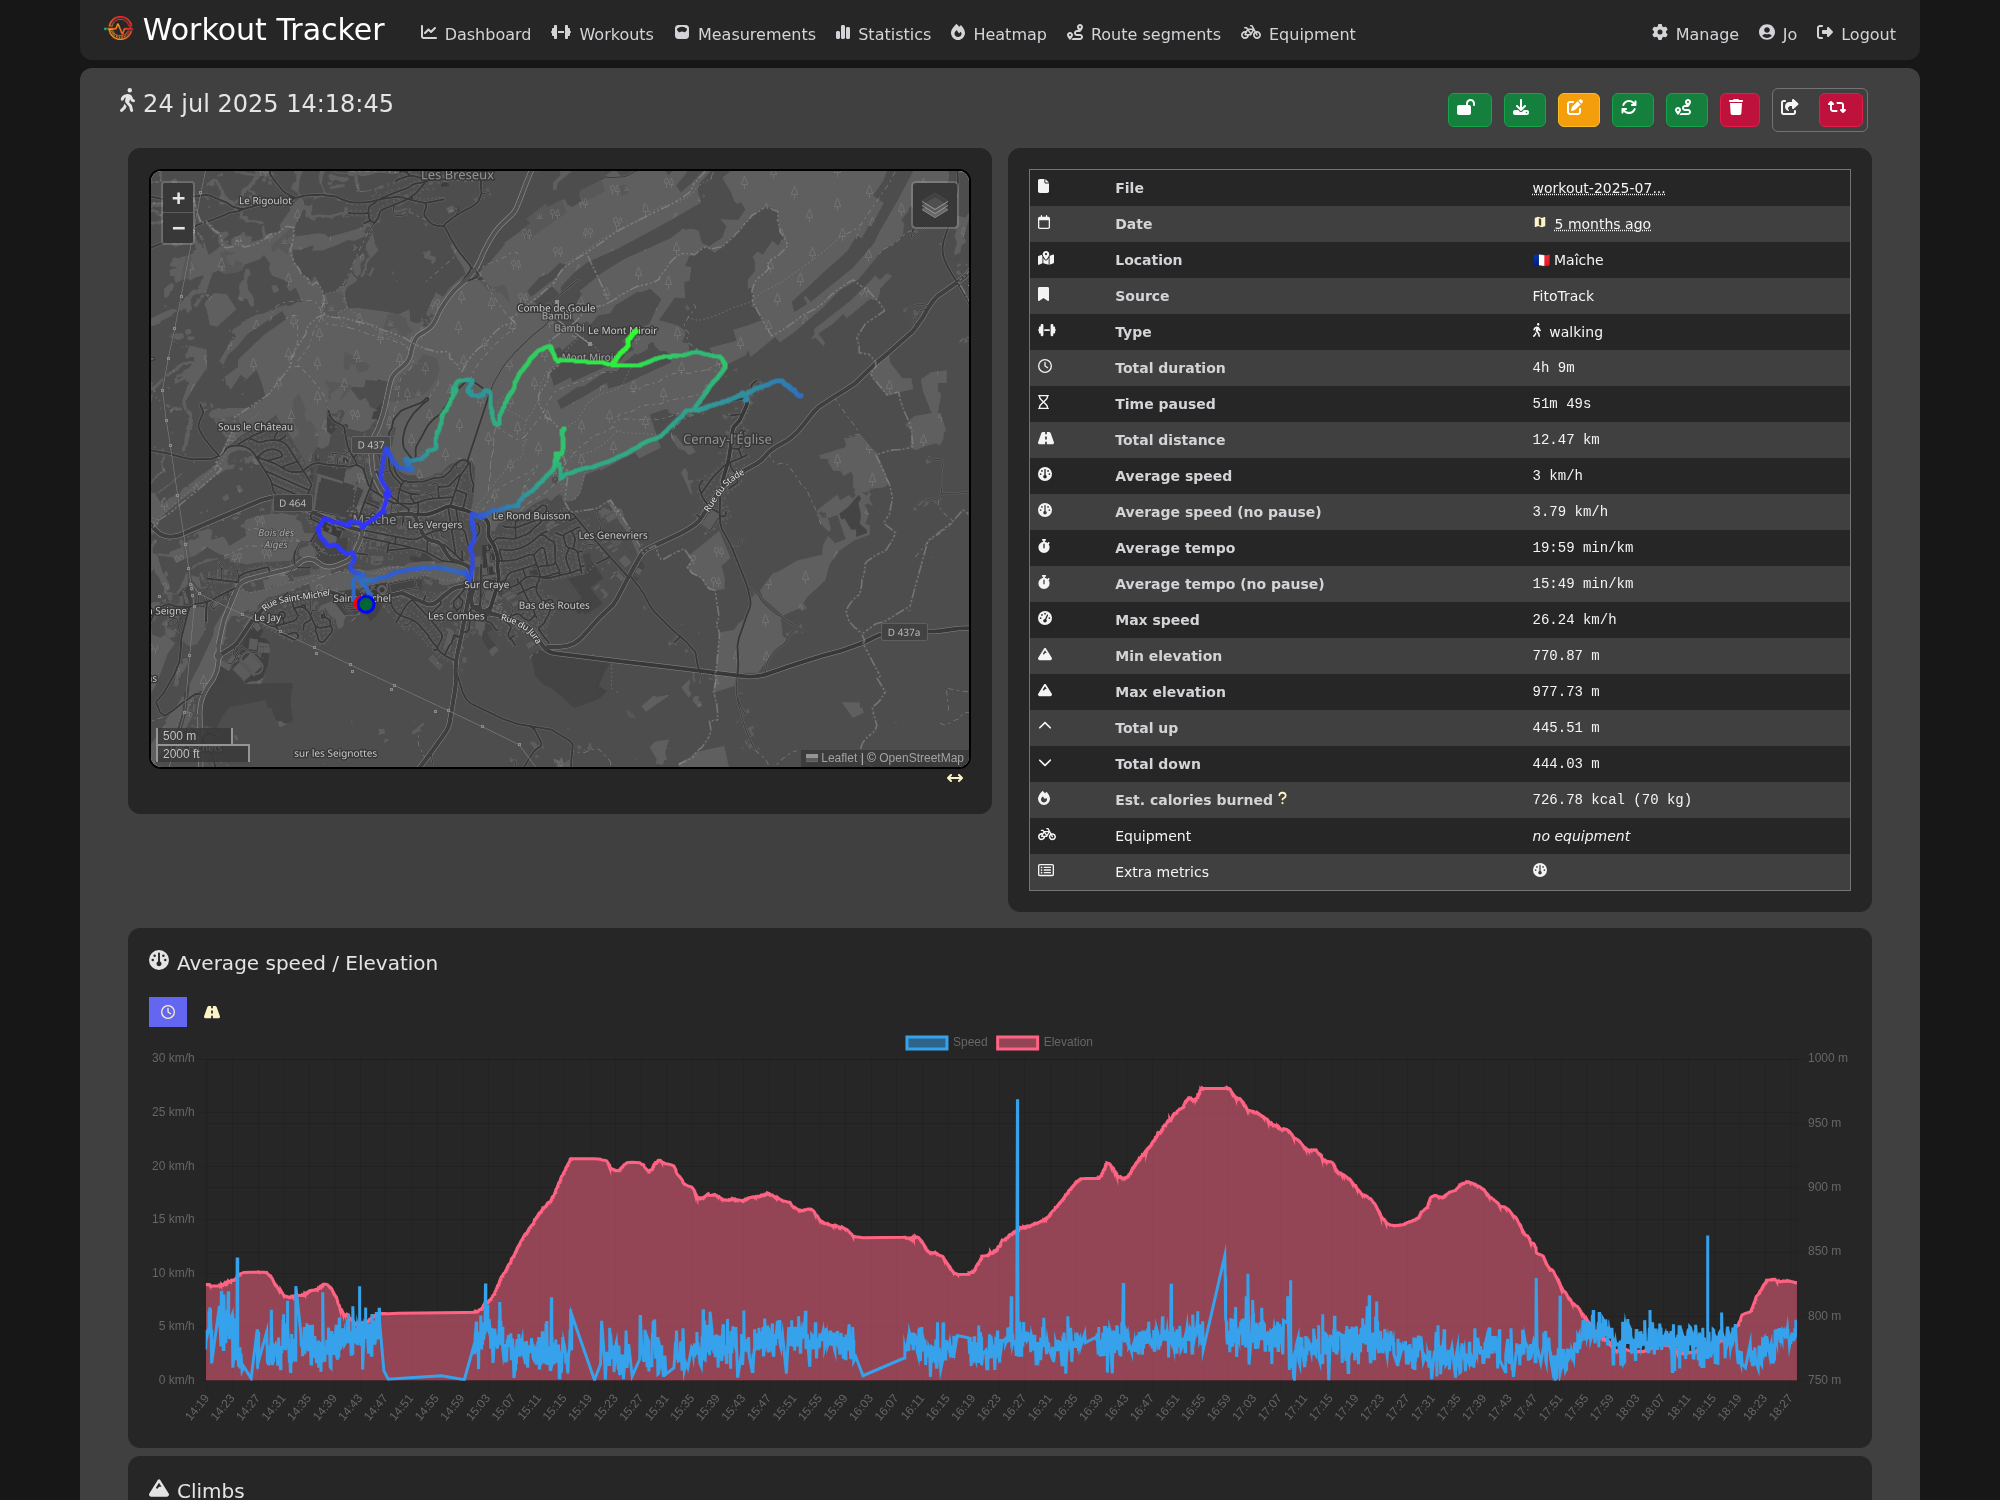
Details of a workout, with:
- a zoomable, dragable map of the GPX track with more details per point
- many summarized statistics
- a breakdown per kilometer or per mile
- track color based on elevation of the segment
- graph of average speed and elevation per minute
- optional graph of heart rate, cadans
Tooltips for even more information
- green and red circle are start and end points of the track
- every point on the track has a tooltip with a summary at that moment
- hover over the breakdown per kilometer to highlight the point
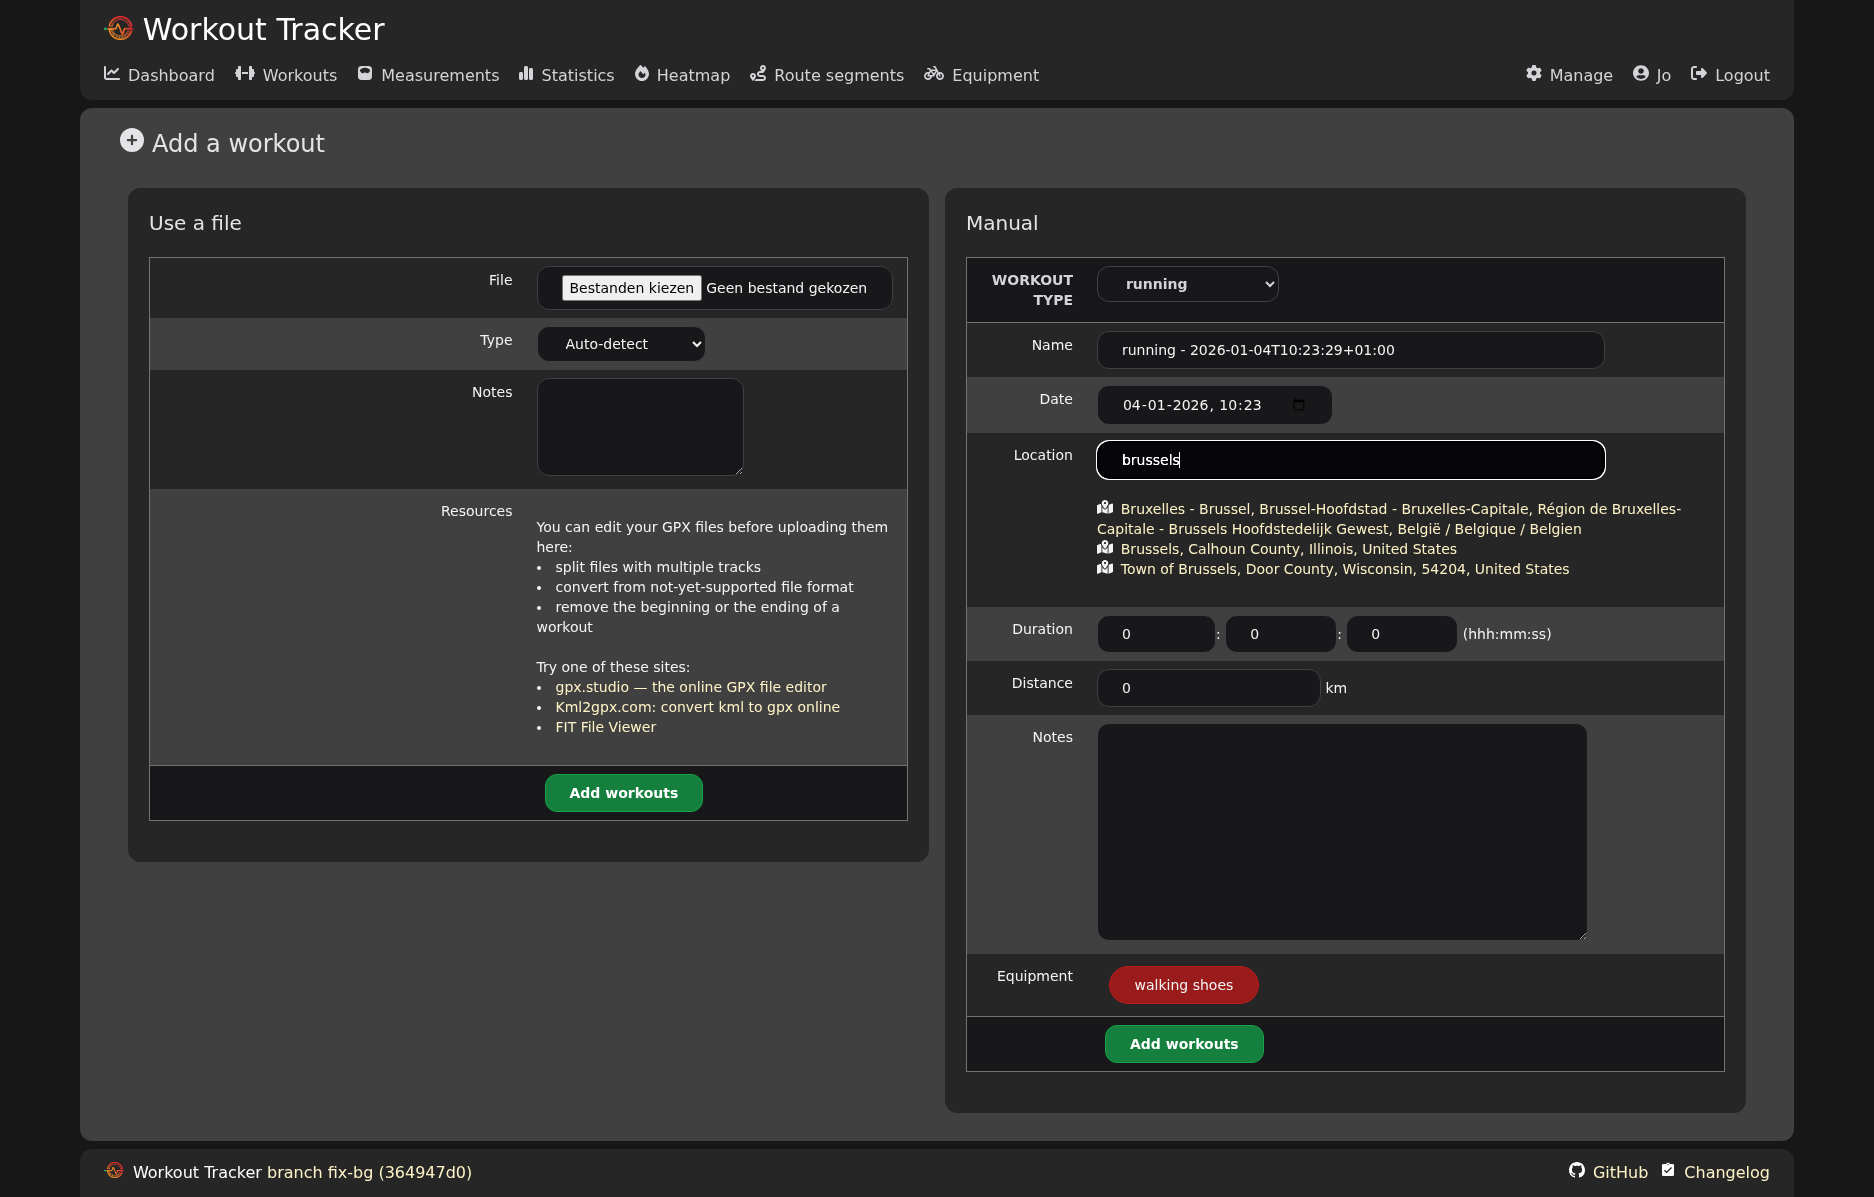
Upload your files
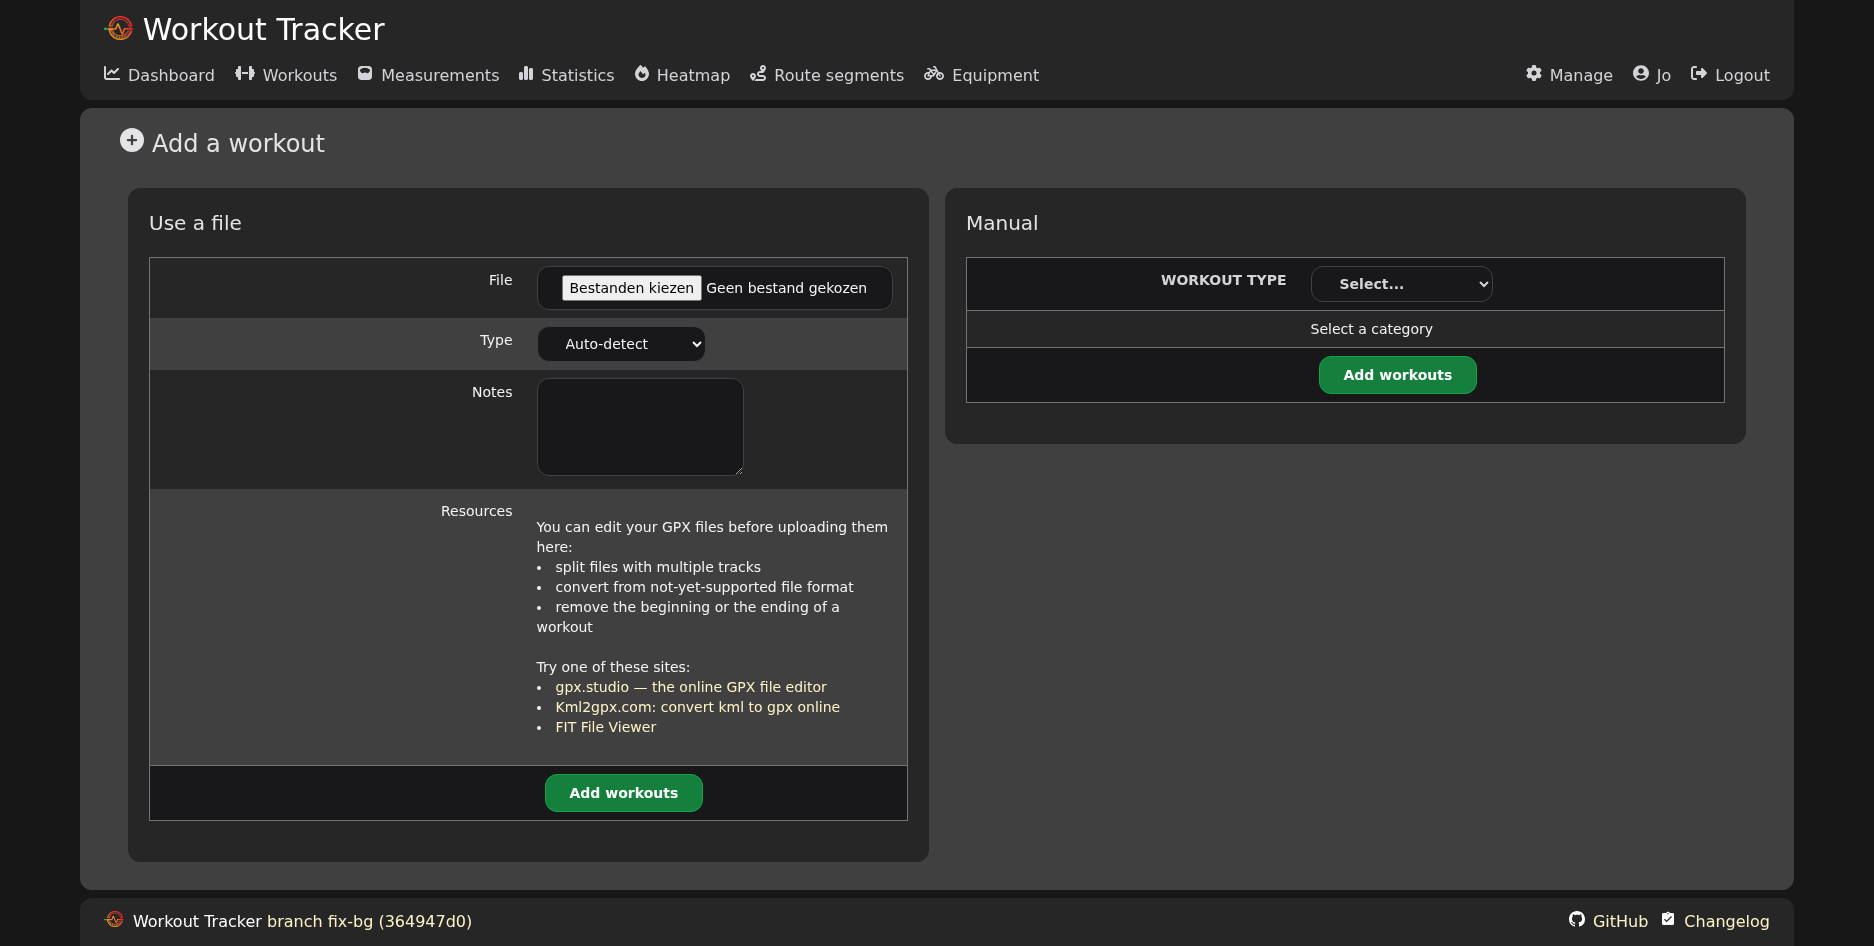
- Upload one or multiple GPX files.
- Pick the type (running, cycling, …) or let the application guess based on average speed.
- The files are parsed when uploaded: statistics and other information are calculated and stored in the database (serialized).
- Or add a workout manually.
Statistics to follow your progress
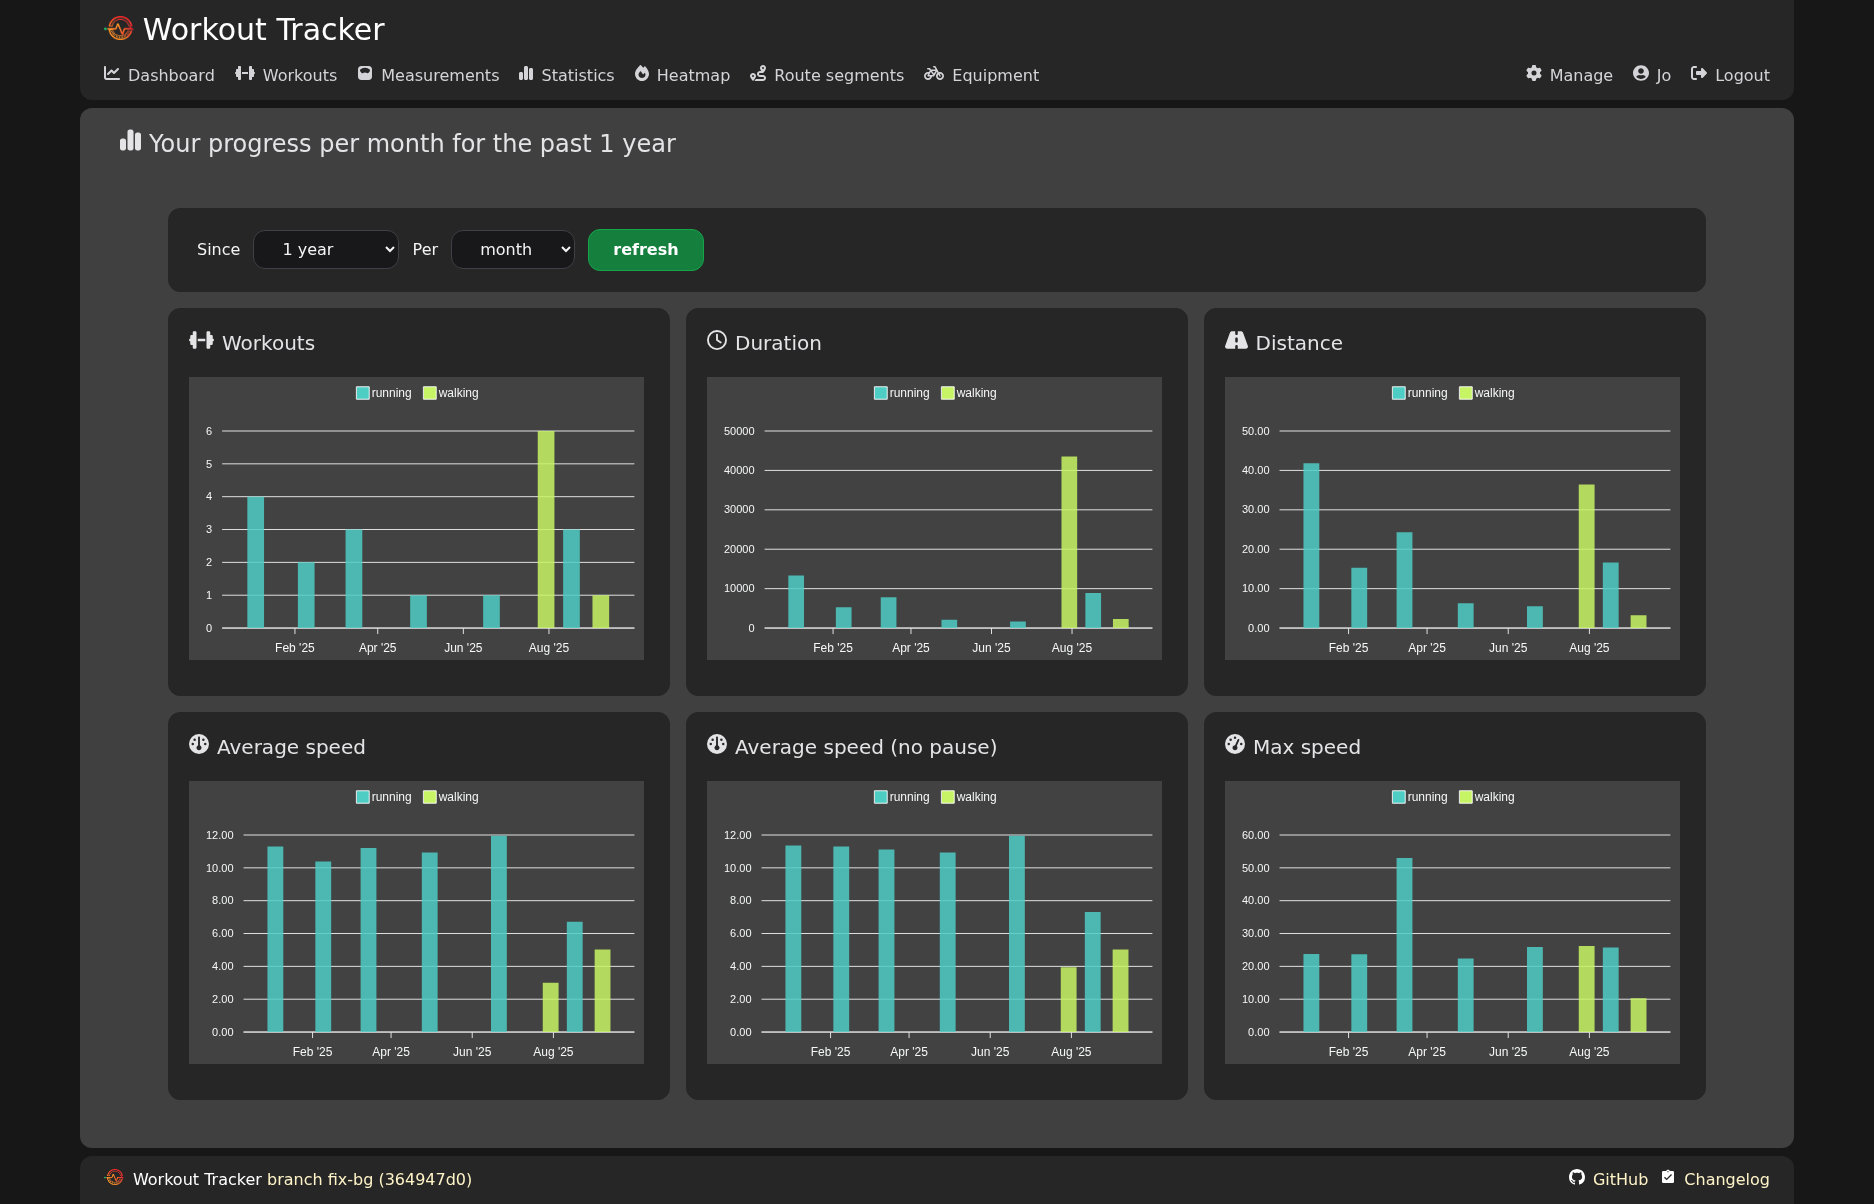
- Graphs showing monthly aggregated statistics.
- Pick different time range or bucket size.
Heatmap: where have you been?
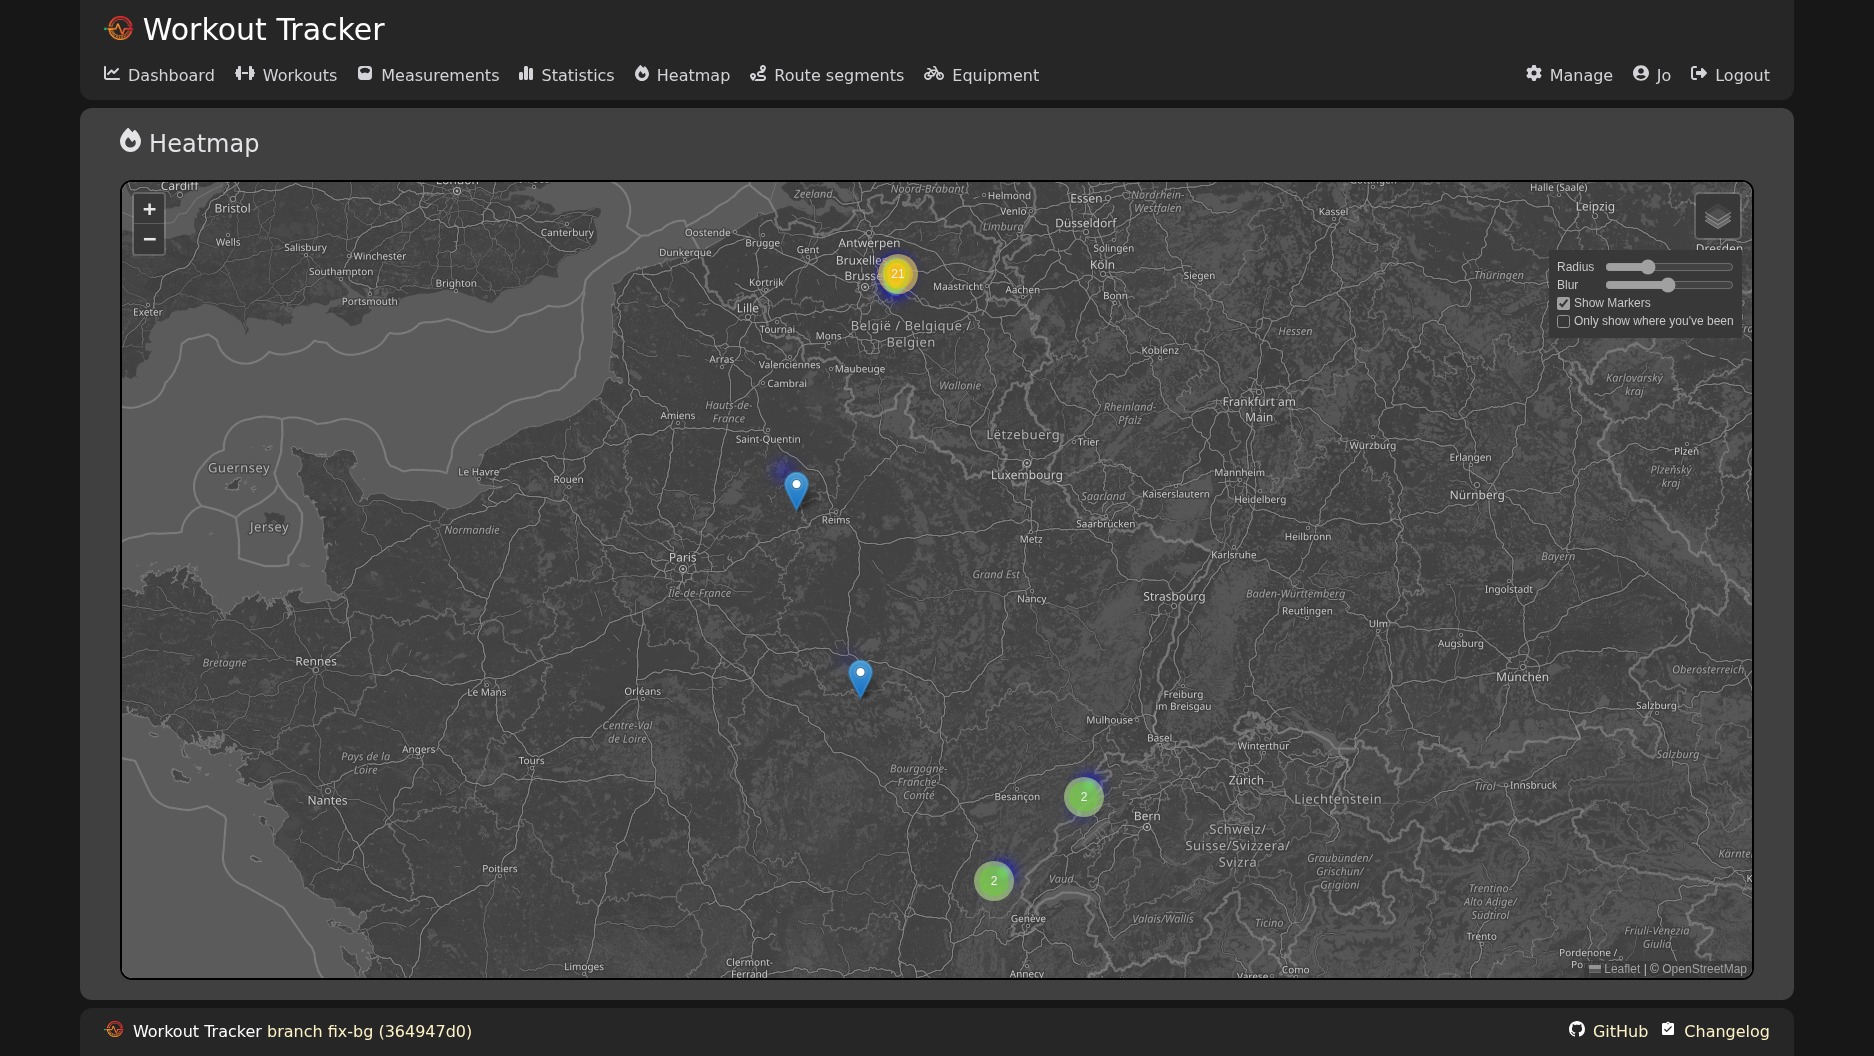
- Pan and zoom through over the map
Daily measurements
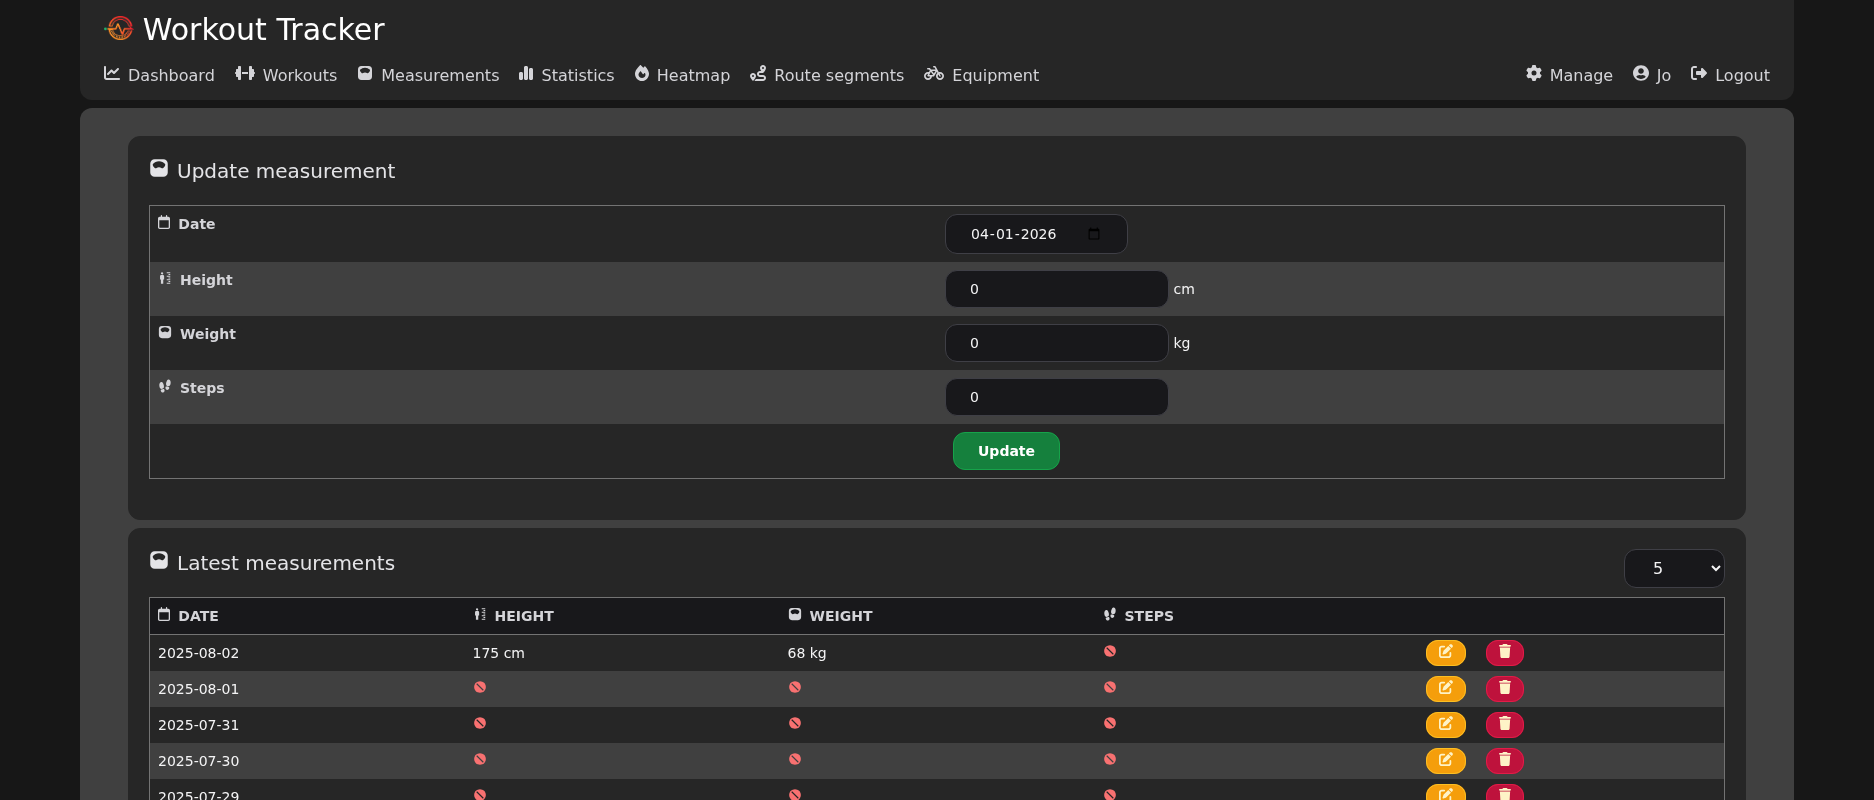
- Keep track of your daily stats, like weight and steps.
- Used to calculate estimated calories burned during a workout.
Basic multi-language support
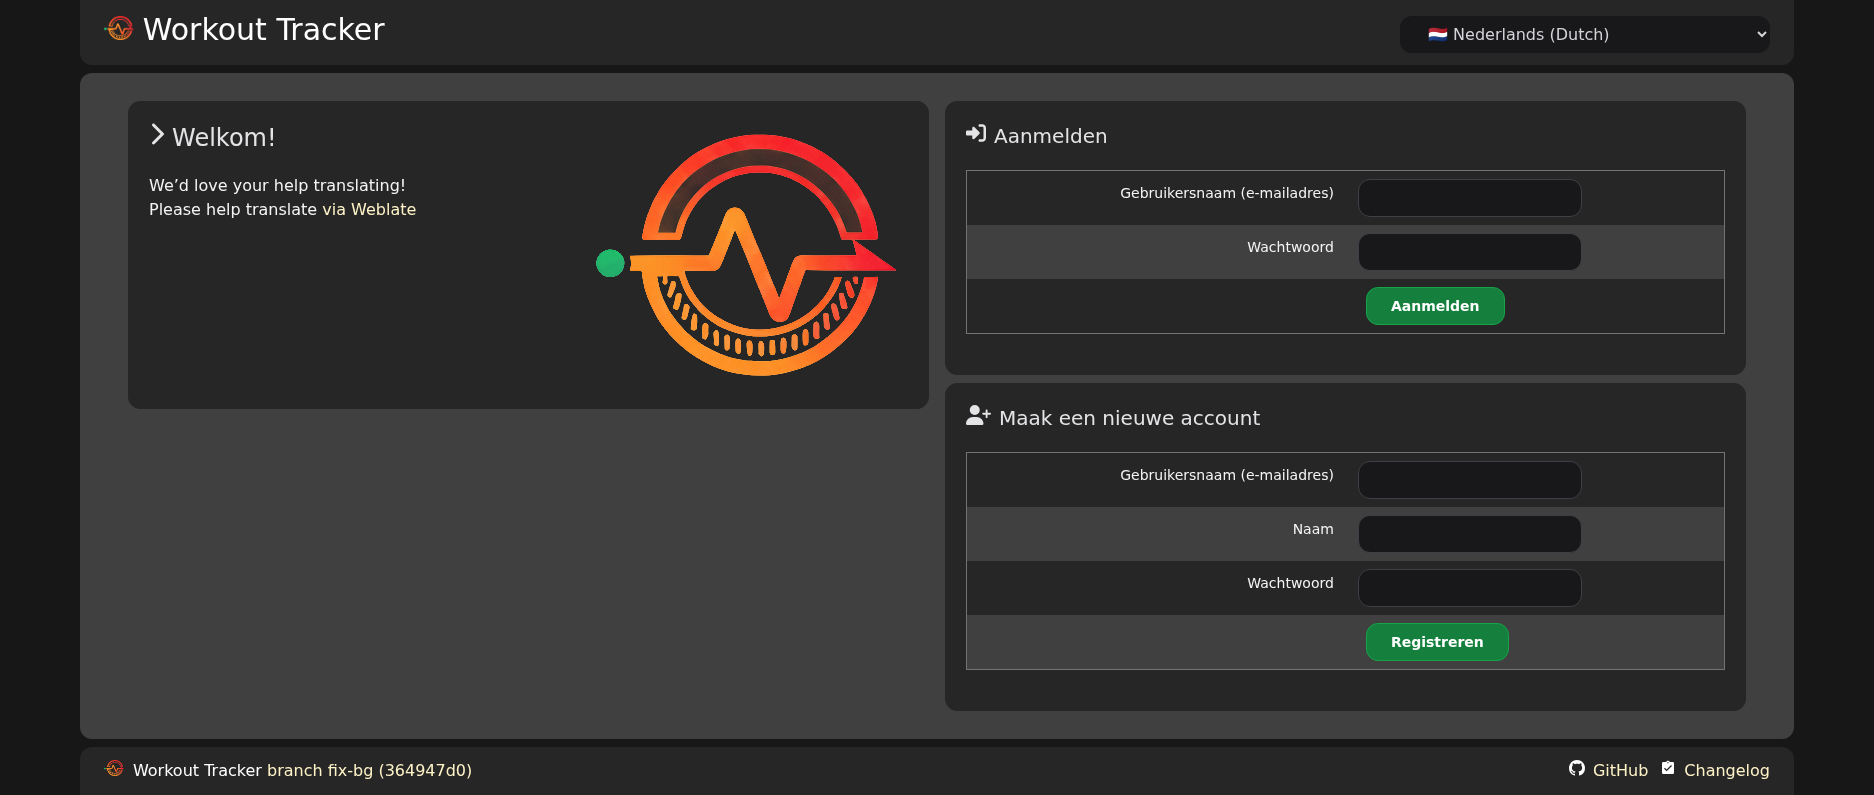
- Switch between (supported) languages
- Please help translate via Weblate
- Use the language configured in the browser (default)
- Very limited amount of languages supported for now

- Re-calculate all previously uploaded workouts (useful while developing)
Responsive design
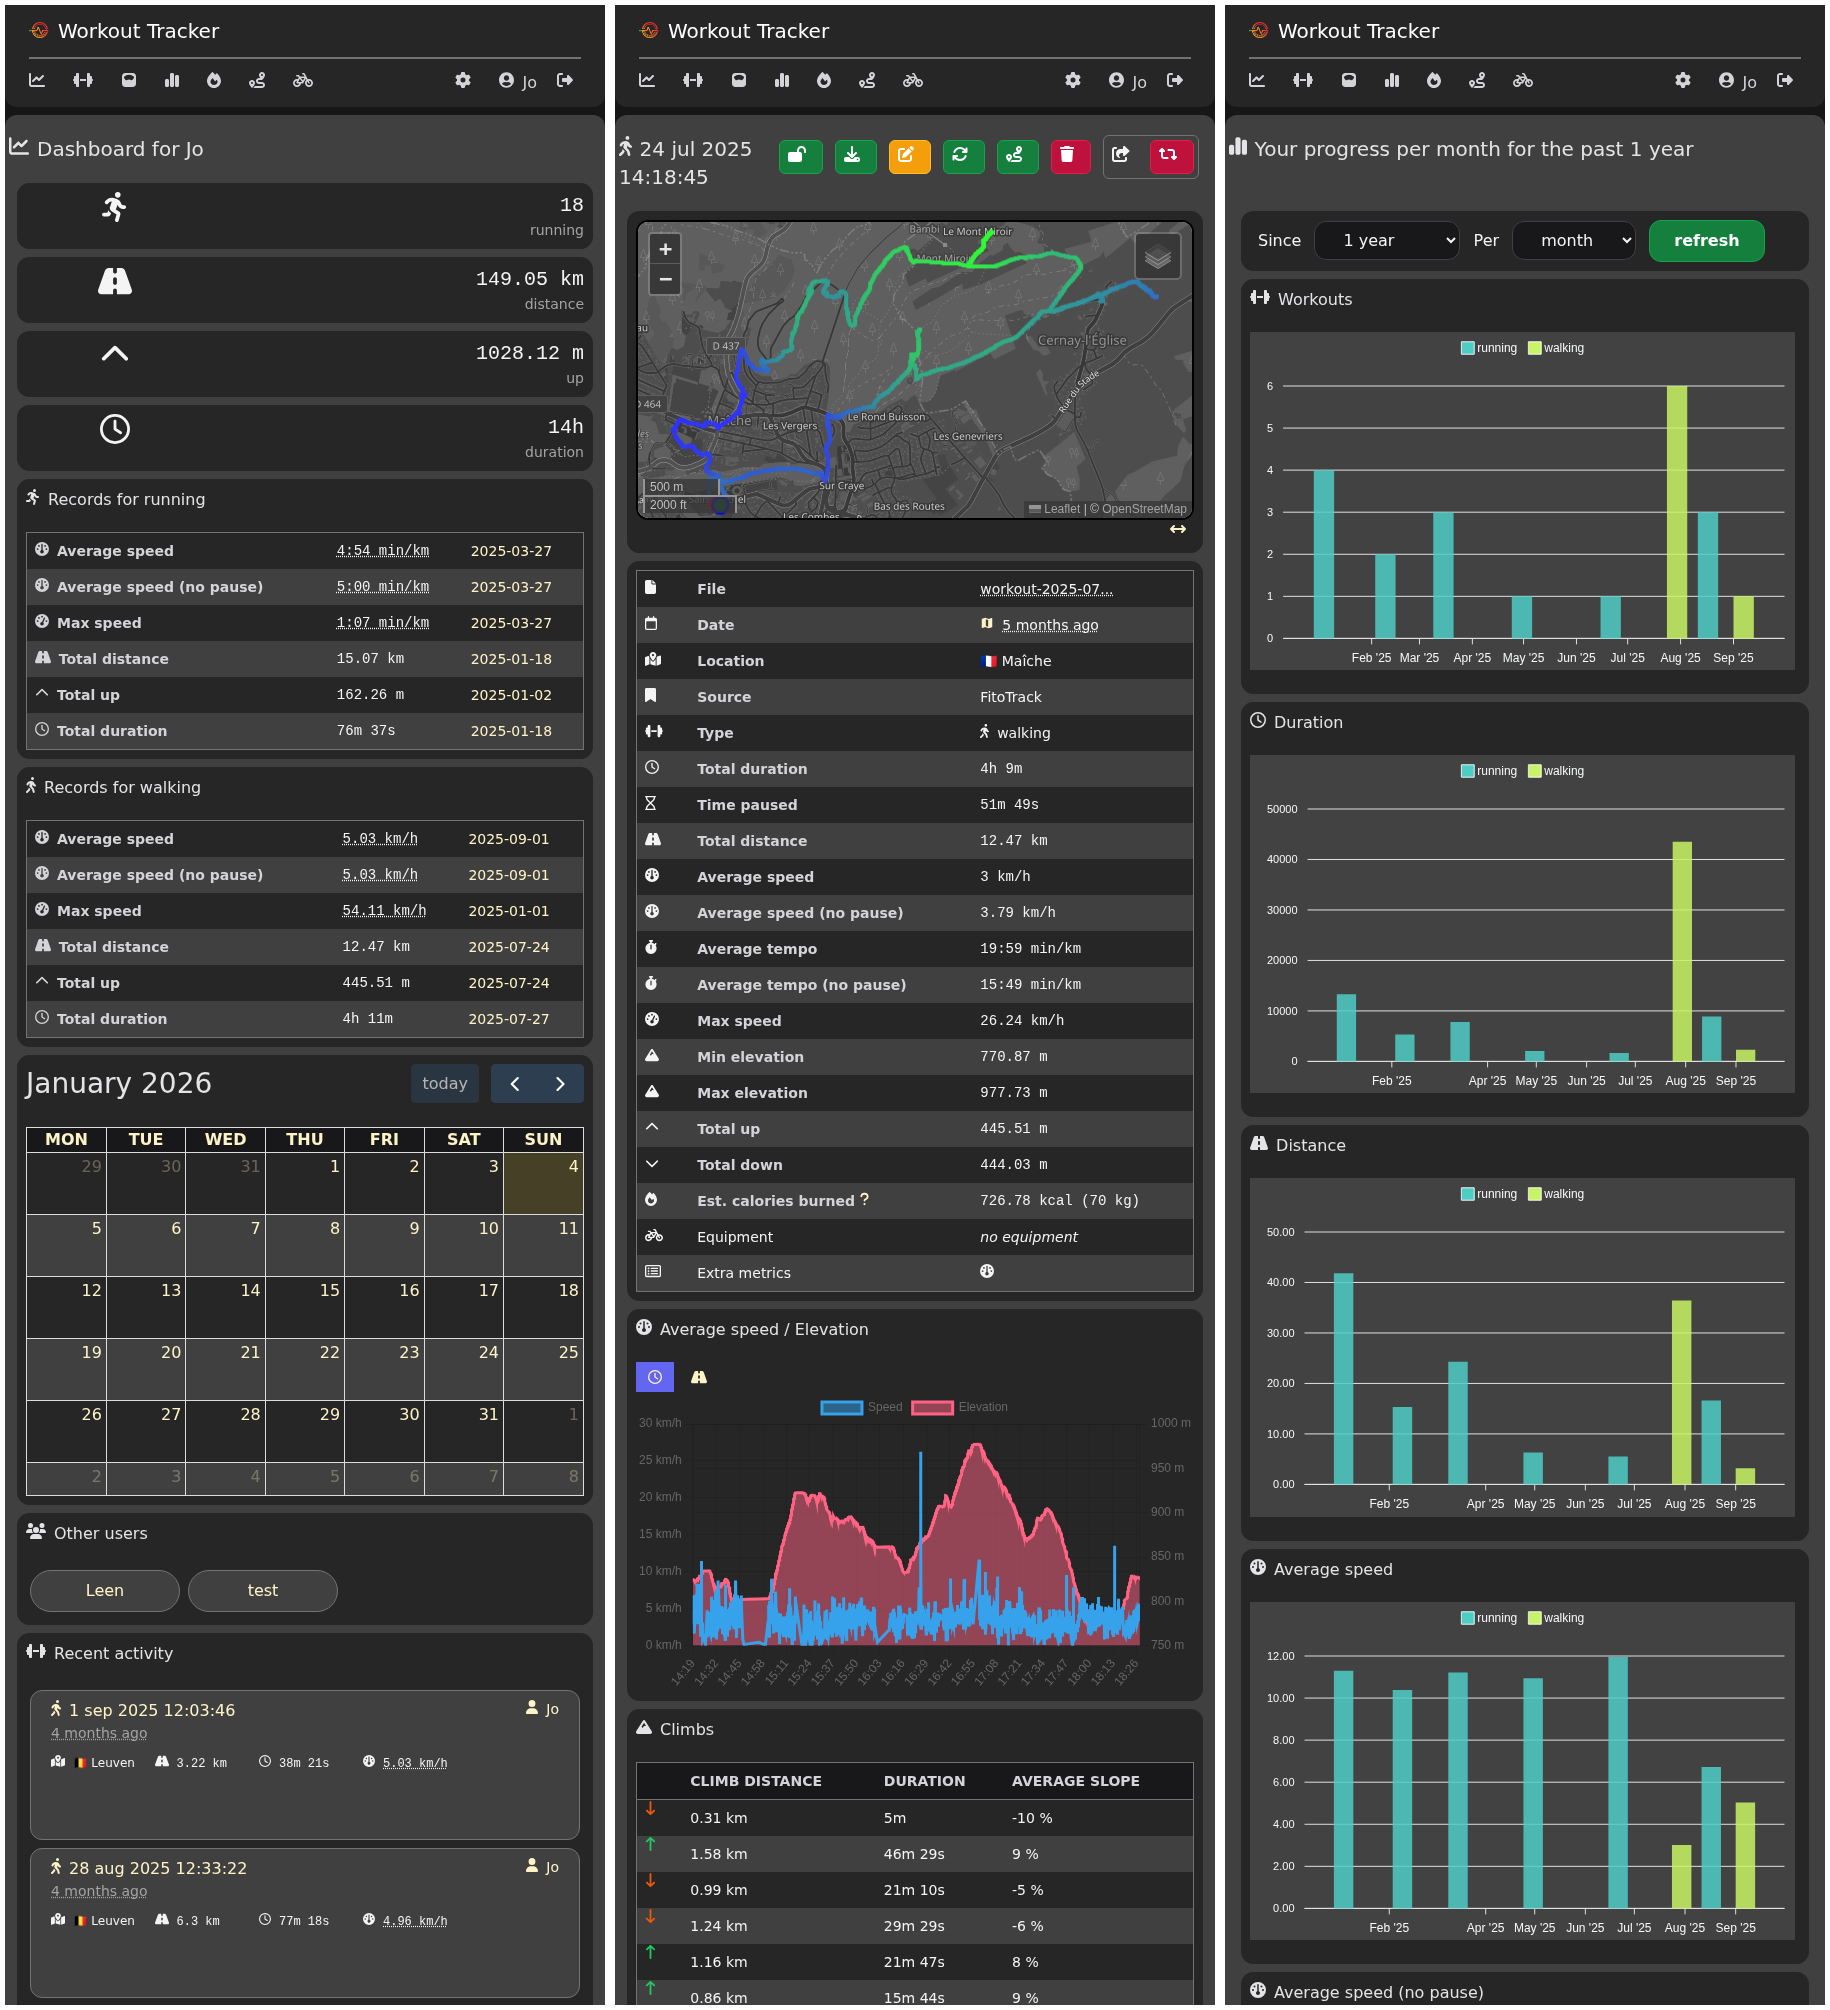
- Usable on small and medium screens
Light and dark mode
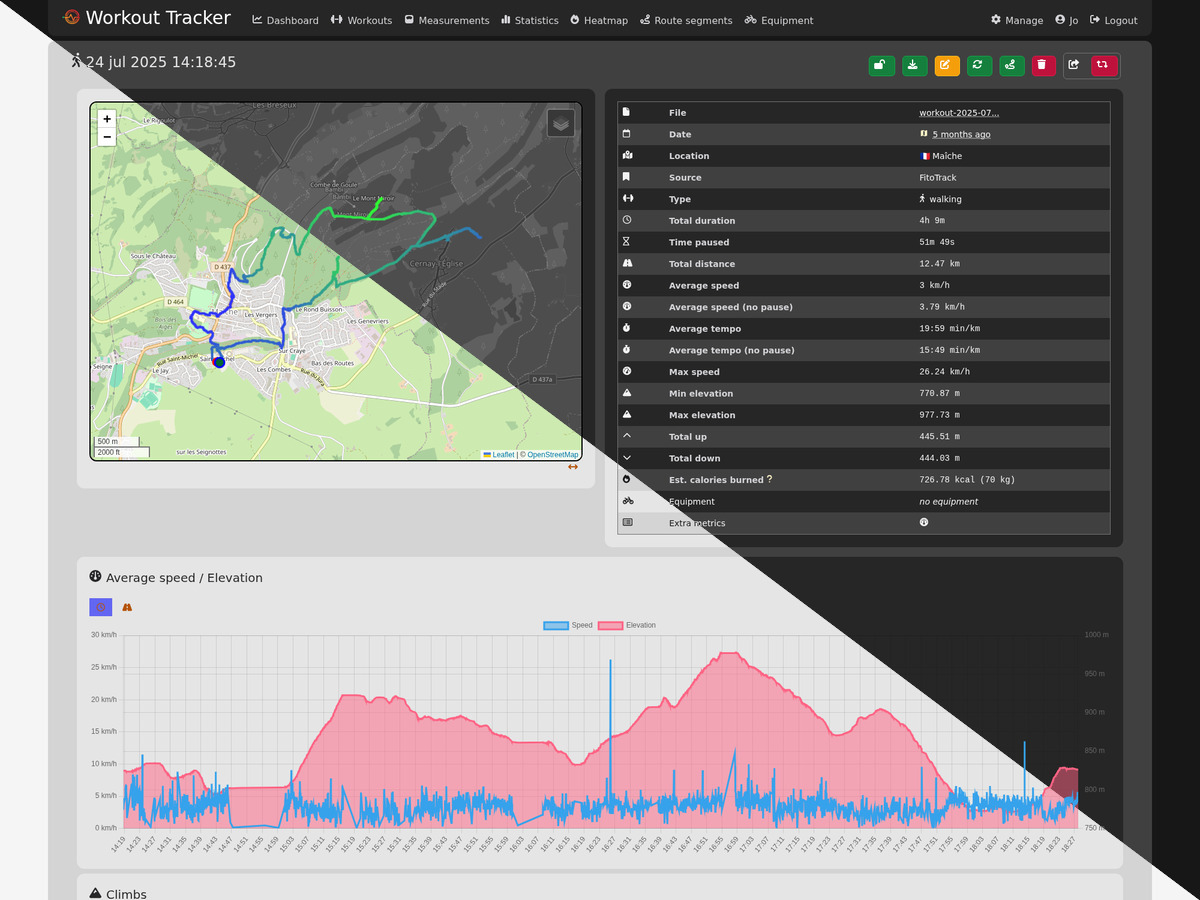
- Browser decides whether to use light or dark mode, based on your preferences